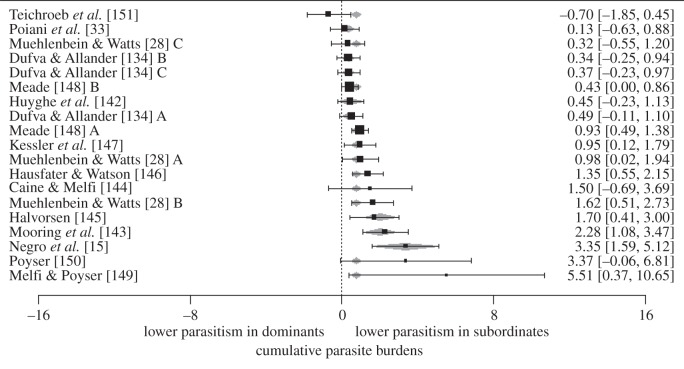
Figure 4.
A forest plot showing the effect sizes of all studies that tested the effects of social status on patterns of parasitism. Positive values indicate lower parasitism in subordinates; negative values indicate higher parasitism in dominants. The values in brackets represent the 95% CI lower limit and the 95% CI upper limit; the value outside brackets represents the effect size (d) of each study. Letters following an author's name represent studies of the same test on multiple, independent populations. Grey diamonds represent a fitted value for each study that incorporates taxa as a moderator.

