
Figure 2.
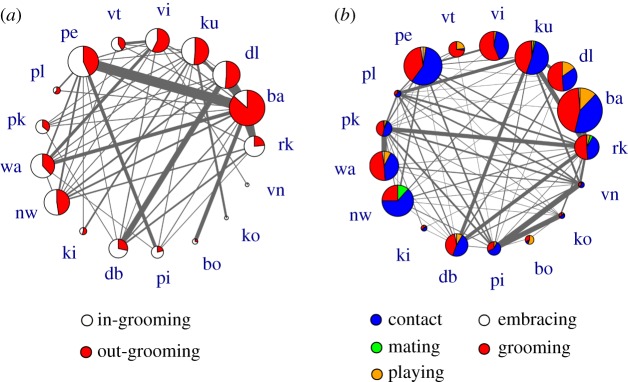
Grooming network and topology of contacts between individuals of the study group. (a) Pies of nodes represent the percentage of grooming during which an individual was grooming other individuals (outgrooming, red) versus receiving grooming (in-grooming, white) from another individual of the group. (b) Social network showing the proportion of the most common types of social interactions per individual. The size of each pie is proportional to the number of individual links. In both networks, the link width was set proportional to the grooming frequency and the overall physical contact frequency for the grooming network and for the overall contact network, respectively. Individual identity of each spider monkey is indicated by a two-letter code. (Online version in colour.)