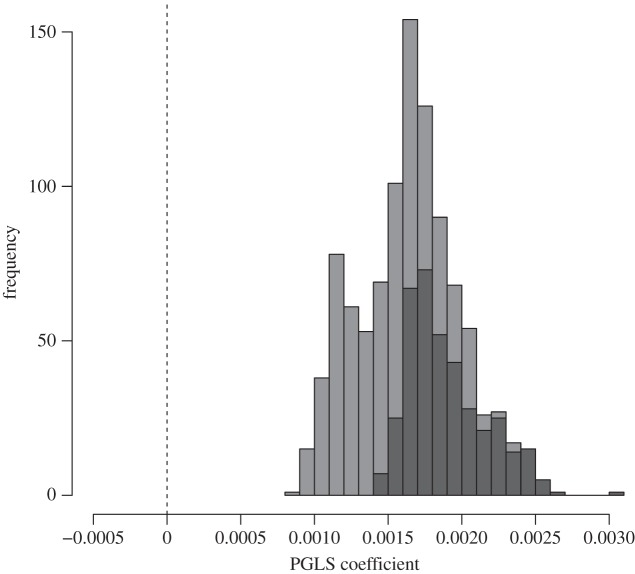
Figure 2.
Distribution of regression coefficients for the association between group size and modularity in comparative analyses. The distribution is based on random selection of a single value per species in the comparative analysis to account for intraspecific variation. Darker bars indicate proportions of statistical results that were significant at p < 0.05.

