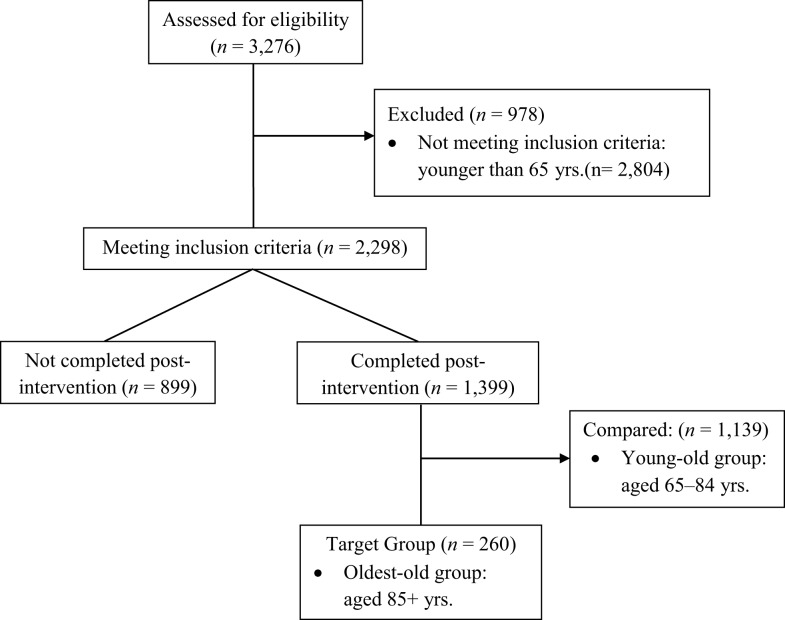
Figure 2.
Diagram for participants inclusion. No statistical differences found in sex, age, and the number of chronic conditions. Statistical differences found between those who completed and did not complete post-intervention for African-Americans, Hispanics, and those with less than high school education.

