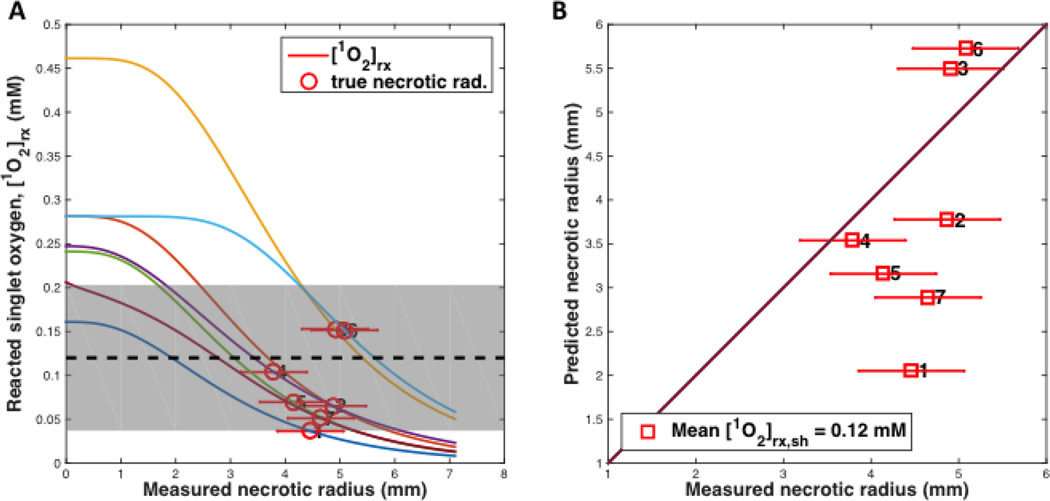
Figure 4.
(A) [1O2]rx profiles for 21 mice (7×3=21, 7 groups) using the model parameters (ξ, σ, β, g) in Table 5 for benzoporphyrin derivative monoacid ring A (BPD) with a drug-light interval of 15 min (a preliminary study). The corresponding initial photosensitizer (PS) concentration, linear source (LS) source strength (mW/cm), treatment (TX) time (s), μa, μs’, and fluence rate at radius of necrosis (mW/cm2) for each group of 3 mice are shown in Table 4. The symbol with error bar indicates the PDT-induced necrotic radius r with standard deviation for each mouse. (B) PDT-induced necrotic radius predicted vs. measured for mice shown in figure (A). (The 21 mice were numbered 1 … 7, each is an average of 3 mice)

