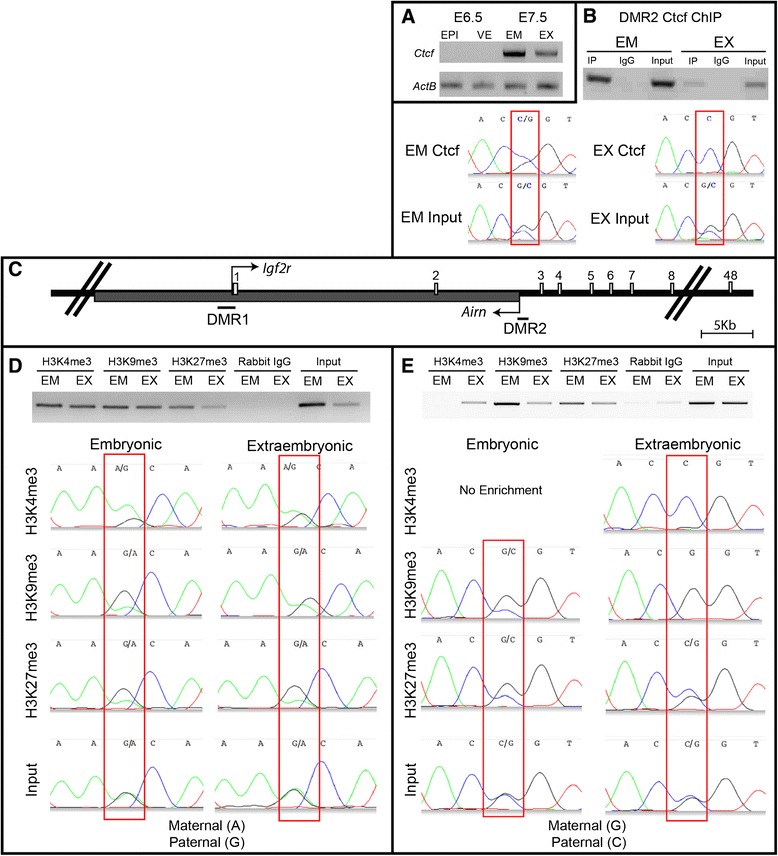
Figure 4.

Chromatin modification at DMR2. (A) Ctcf RT-PCR indicates no/trace expression of Ctcf in both EPI and VE at E6.5. Ctcf is expressed in both lineages at E7.5. (B) Ctcf ChIP at DMR2 with E8.5 chromatin shows binding in both embryonic and extraembryonic tissues. Sequencing of ChIP-PCR products indicates allele-specific Ctcf enrichment of the paternal allele in the extraembryonic tissue, but both alleles are bound in embryonic tissue (although biased toward the paternal allele). (C) Illustration of DMR1 and DMR2 in relation to the start sites of Igf2r and Airn. (D-E) H3K4me3, H3K9me3, and H3K27me3 ChIP-PCR of DMR1 and DMR2 on E8.5 chromatin. Sequencing of ChIP-PCR products shows allele-specific enrichment in embryonic tissues at DMR1 and extraembryonic tissue at DMR2. The position of the polymorphism is boxed in red on each electropherogram. DMR1 (A, maternal; G, paternal). DMR2 (G, maternal B6; C, paternal PWD).
