Figure 4.

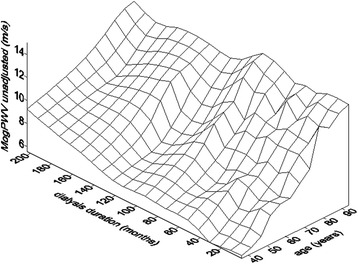
Pulse Wave Velocity and dialysis duration. Surface-plot showing the relationship among months on dialysis, age and MogPWV.

Pulse Wave Velocity and dialysis duration. Surface-plot showing the relationship among months on dialysis, age and MogPWV.