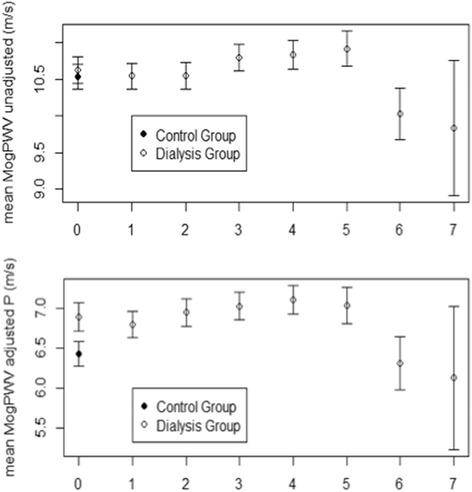
Figure 5.

Pulse Wave Velocity at the inclusion and follow up visits. MogPWV are systolic blood pressure adjusted (above) and unadjusted (below) values respectively. 0: inclusion visits for subjects of the control and dialysis groups respectively; 1–7: follow-up visits for the dialysis group. Values are given in mean; SD is depicted.
