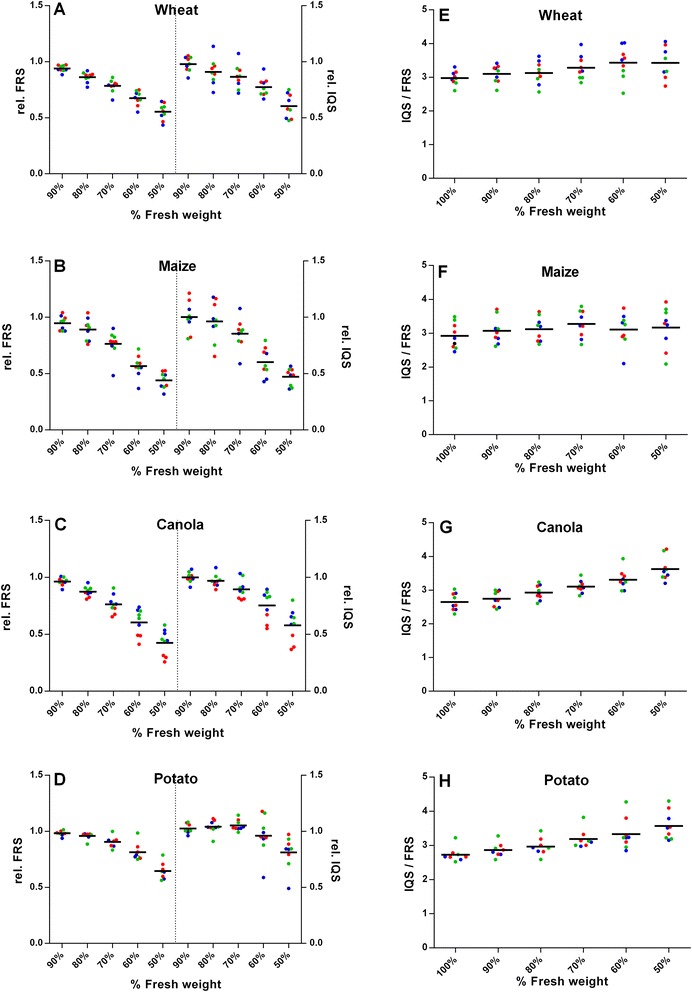
Figure 3.

Experimental results of microwave measurements on leaves from four different crops. The analysis was performed at six time-points from initial fresh weight (100%) up to 50% of the initial weight by consecutive 10% drying in each step. (A) - Wheat, (B)-Maize, (C) - Canola, and (D) - Potato. Normalized FRS and IQS values based on values at 100% fresh weight for FRS and IQS, respectively are shown. E (Wheat), F (Maize), G (Canola) and H (Potato ) display IQS values divided by FRS values for single leaves at different drying stages, and water contents, respectively. Bars indicate arithmetic means over three leaves. The absolute averaged FRS values at 100% fresh weight are 5.5⋅10−5 for wheat, 1.25⋅10−4 for maize, 1.41⋅10−4 for canola and 1.24⋅10−4 for potato. The colors of the dots indicate the developmental stage of the leaves: blue (first stage, young leaf), green (second stage, intermediate leaf) and red dots (third stage, older leaf).
