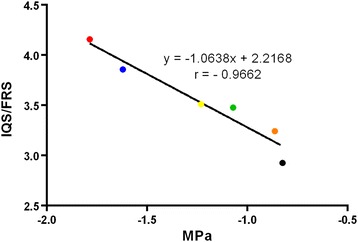
Figure 5.

Correlation between osmotic potential and IQS/FRS values for canola leaves. Dot-colors indicate measurement of leaves with water content decreasing stepwise: black – 100% (initial fresh weight); brown – 90%, green – 80%; yellow – 70%; blue – 60% and red – 50% of the initial weight. Each dot represents the mean values from four leaves. For each leave, two measurements were performed to define osmotic potential and five for the IQS/FRS value.
