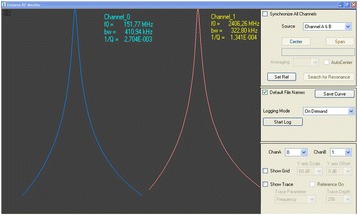
Figure 6.

Screenshot of the user interface of the dual-mode sensor system. Blue and red curves display the measured resonance of a measurement of modes 0 and 1, respectively. Shown are the values of resonance frequency (f0), inverse Q factor and 3 dB bandwidth bw = f_0/Q for both modes, as determined by a Lorentz fit (Eq. 2). The axis of these plots (horizontal = frequency), (vertical = detector voltage) are not depicted on the screenshot, the control panel on the right hand side of the screen shot is not relevant for the presented analysis.
