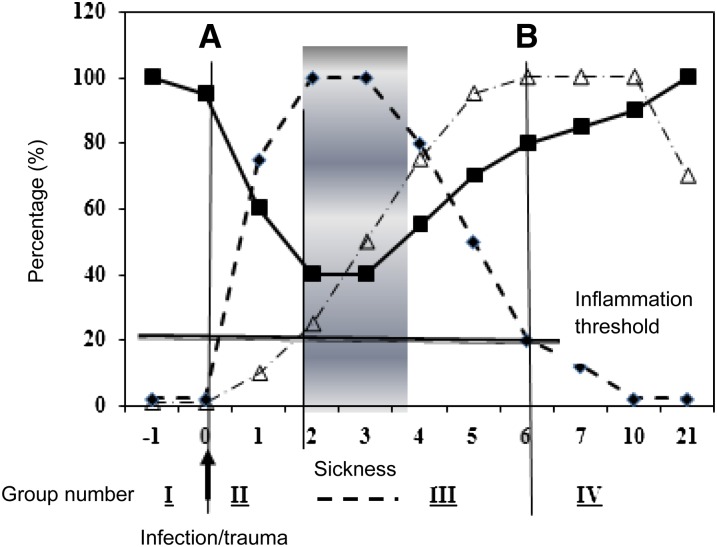
FIGURE 2.
Model of the behavior of the plasma acute phase proteins CRP and AGP and retinol concentrations after an infection or trauma. The ordinate axis indicates arbitrary % values where zero represents normal and 20% the inflammation threshold of CRP (>5 mg/L) and AGP (>1 g/L); 100% represents a normal serum retinol concentration or the maximum increase in CRP or AGP concentrations. The figure shows the rapid increase in CRP (line with short dashes) and decrease in retinol concentrations (solid line) after an infection stimulus at time zero (A). The CRP concentration reaches a plateau when clinical evidence of sickness appears and retinol reaches its nadir. AGP (line with combination of short and long dashes) concentrations increase more slowly from time zero and only pass the inflammation threshold 2–5 d later. As sickness wanes, concentrations of CRP decrease, retinol increases, and AGP reaches a plateau. In the final stage of convalescence, CRP concentrations return to normal (B), leaving only AGP elevated. The horizontal solid line at 20% is an arbitrary inflammation threshold. See text for details. The model is used to categorize subjects in the following groups: I, reference (no elevated acute phase proteins); II, incubation (only CRP increased); III, early convalescence (CRP and AGP both above the inflammation threshold); and IV, late convalescence (only AGP is raised). AGP, α1-acid glycoprotein; CRP, C-reactive protein. Modified from reference 21.

