
Figure 2.
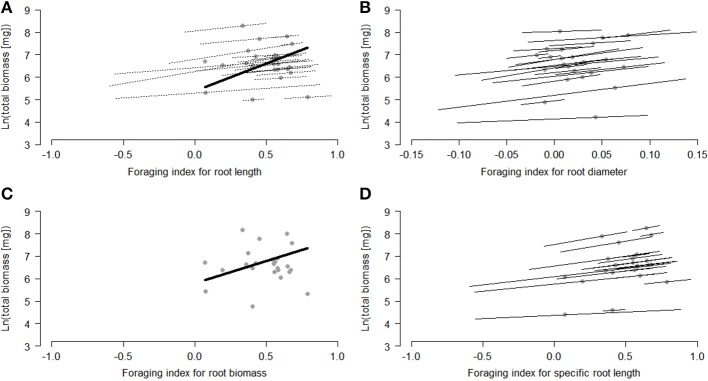
Relationships between root-foraging indices and plant performance [ln (total plant biomass)] within and among the study species. The modeled mean effects of each species are indicated by the dots. When the within-species relationships were significant or marginally significant, they are shown by the thin lines through each dot. When the among-species relationship was significant or marginally significant, it is shown by the thick line. Foraging responses were measured as (A) root length, (B) root diameter, (C) root biomass, and (D) specific root length, and performance as the ln-transformed total plant biomass. For calculation of the foraging index see the section ' Testing the adaptive value of root foraging Significant effects are presented as follows: within-species: p > 0.1 (no lines), 0.05 < p > 0.1 (dotted lines), p < 0.05 (solid lines); among-species: p > 0.1 (no line) and 0.1 < p > 0.05 (dotted line). The length of the line represents the within-species and among-species spread in the foraging index.