
Fig. 2:
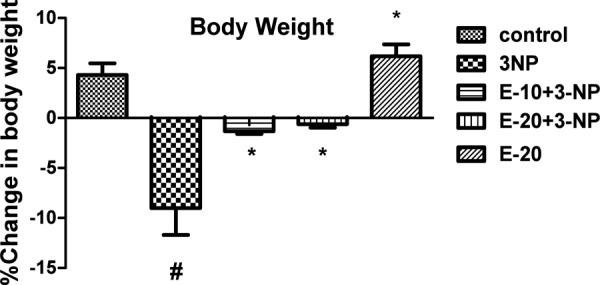
Effect of Escitalopram on Body Weight.
Values are expressed as mean ± standard deviation (SD); n = 6. Significance determined using one way ANOVA followed by Tukey’s test. #Statistically significant from control group (p<0.05).*Statistically significant from 3-NP treated group (p<0.05).