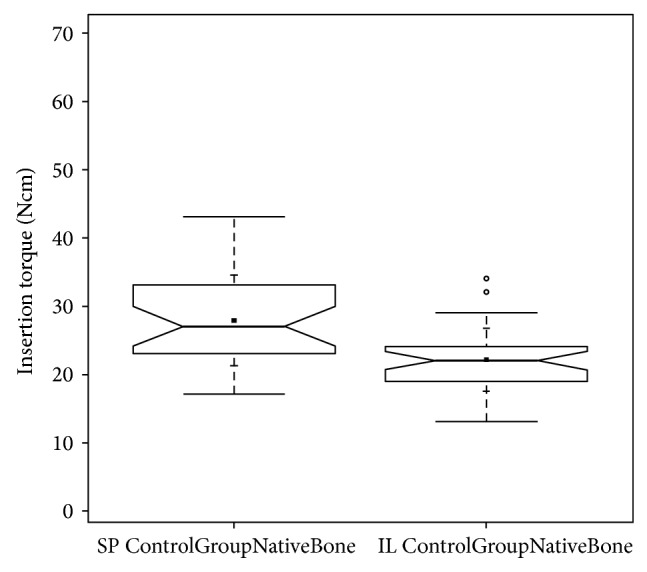
Figure 17.

ITV-comparison notched box plot of native anterior maxillary bone (subperiosteal tunnel procedure control group—SP ControlGroupNativeBone) and native molar maxillary bone (INTRALIFT control group—IL ControlGroupNativeBone) depicts the interquartile range (IQR) between the 25th and 75th percentile of the specific biomaterial tested where 50% of the data points were located. Additionally, the upper whiskers represent data within the 75th percentile +1.5 times the IQR. The lower whisker delimits data of the 25th percentile −1.5 times the IQR. Within the boxes the notches mark the confidence interval based on the median ± 1.58 (IQR/sqrt of n) (n = number of measurements). Additionally, the mean value is indicated by a black square and the cross symbol (+) displays the standard deviation. Control group native anterior maxillary bone SP (n = 30), control group native molar maxillary bone IL (n = 35).
