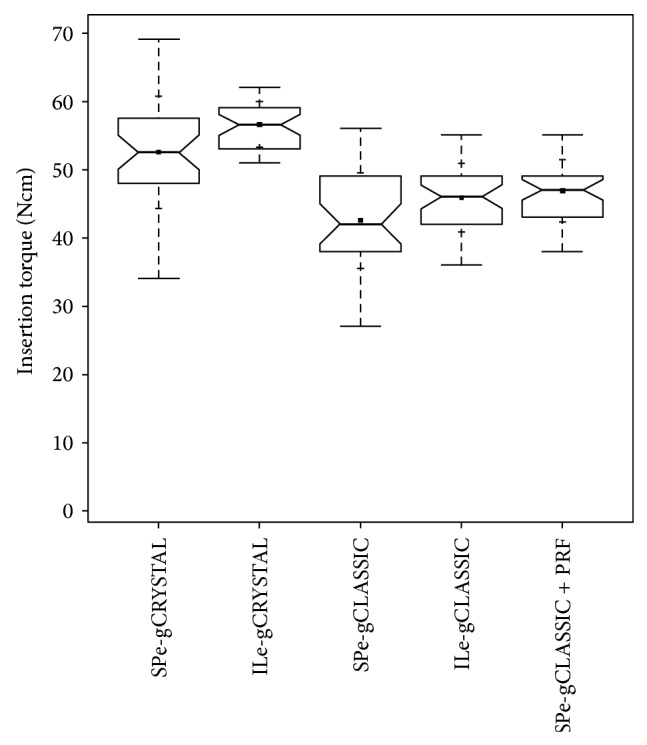
Figure 18.

ITV-comparison notched box plot of the subperiosteal tunnel procedure (SP) in the anterior maxilla and the INTRALIFT-procedure (IL) with BiSHB (e-gCRYSTAL), MoSHB (e-gCLASSIC), and MoSHB + Platelet Rich Fibrin (PRF) (e-gCLASSIC + PRF) depicts the interquartile range (IQR) between the 25th and 75th percentile of the specific biomaterial tested where 50% of the data points were located. Additionally, the upper whiskers represent data within the 75th percentile +1.5 times the IQR. The lower whisker delimits data of the 25th percentile −1.5 times the IQR. Within the boxes the notches mark the confidence interval based on the median ± 1.58 (IQR/sqrt of n) (n = number of measurements). Additionally, the mean value is indicated by a black square and the cross symbol (+) displays the standard deviation. SPe-gCRYSTAL (n = 36), ILe-gCRYSTAL (n = 38), SPe-gCLASSIC (n = 35), ILe-gCLASSIC (n = 41), and SPe-grCLASSIC + PRF (n = 38).
