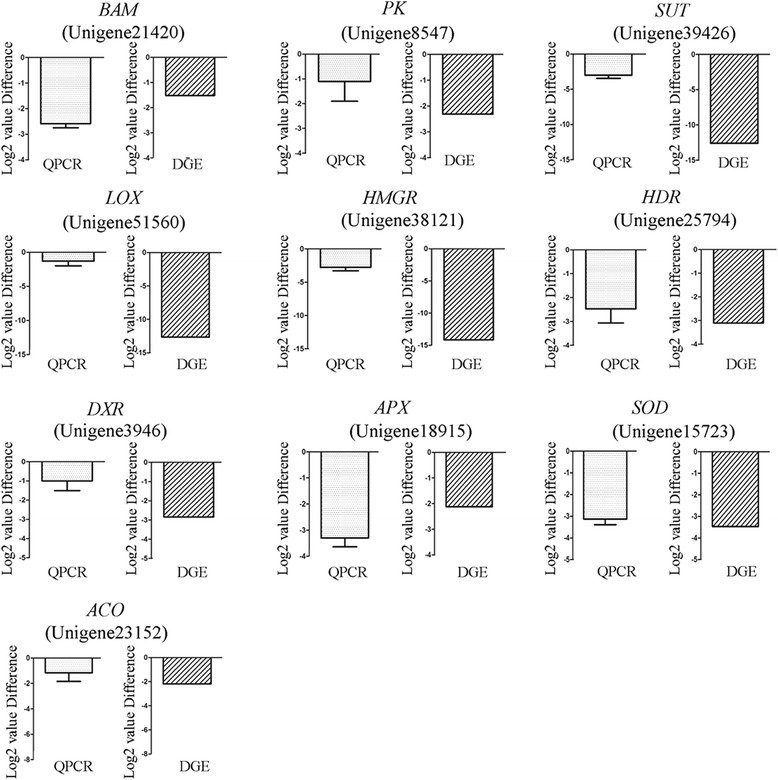
Figure 5.

Differentially expressed unigenes involving hormone, carbohydrate and rubber biosynthesis processes. The left showed qRT-PCR and the right showed DGE data in each schematic. Error bars for qRT-PCR showed the standard deviation of three replicates.
