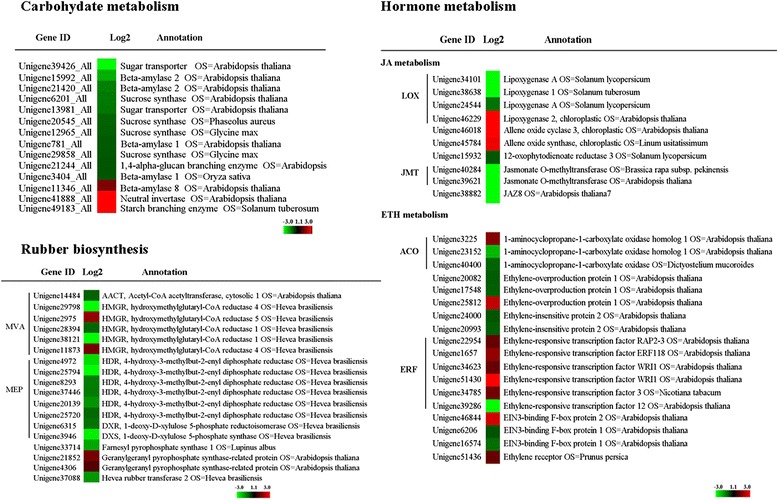
Figure 6.

Heat map of genes involve in carbohydrate metabolism, rubber biosynthesis and hormone metabolism. DGE values displayed as heat map. Colours bar represented expression levels of each gene which were either up-regulated (red) or down-regulated (blue).
