
Figure 8.
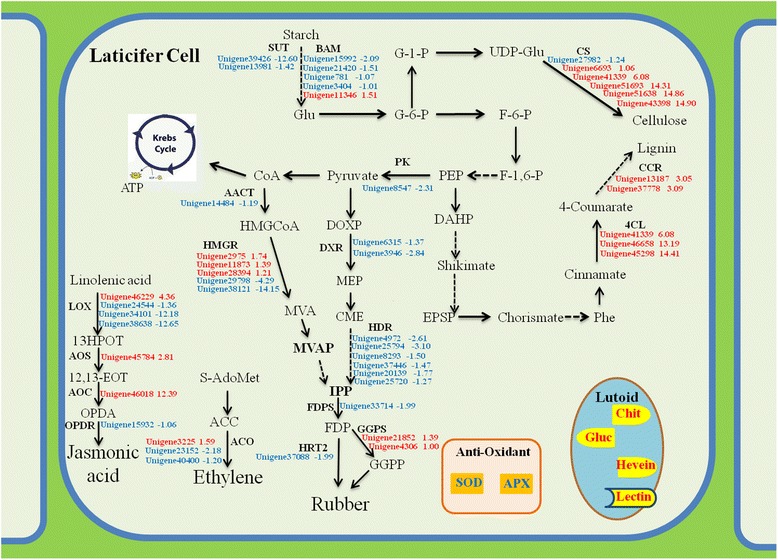
Schematic representation of differentially expressed unigenes related to latex regeneration and duration of latex flow in laticifer cell. Red colors showed unigenes up-regulated in PR107 while down-regulated in CATAS8-79. Blue colors showed unigenes up-regulated in CATAS8-79 while down-regulated in PR107. Numbers represented Log2 values in DGE data. The dashed arrows indicated multiple steps of enzymatic reactions.