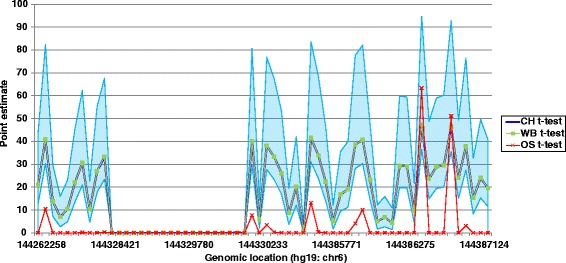
Figure 1.

The performance of three t-tests (one-sample, Weisberg and Crawford-Howell t-tests) around the PLAGL1 region in TND-MLMD 1. The x-axis denotes the genomic location of PLAGL1 on chromosome 6. The y-axis represents the estimated percentage of the control population that would be expected to obtain lower score than the case (point estimate), which is calculated according to the one-sample (OS, red crossed line), Weisberg (WB, green line with green square markers) and Crawford-Howell (CH, blue line) methods. The blue shade represents 95% confidence interval of the point estimates from the noncentrality parameter from a noncentral t-distribution.
