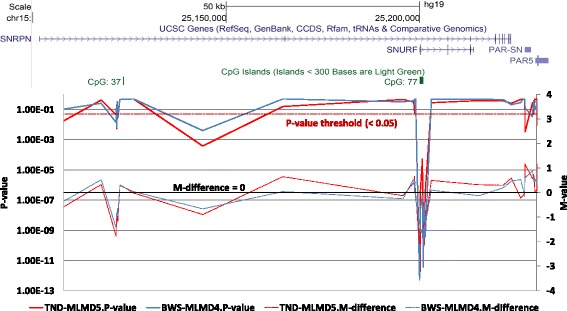
Figure 4.

Identification of hypomethylation at the SNRPN locus in MLMD samples. Upper panel: Genomic location from the UCSC genome browser, illustrating the SNRPN gene and the imprinting control region. Lower panel: graphical presentation of 450 k DNA methylation data across the SNRPN gene in BWS-MLMD 4 (red) and TND-MLMD 5 (blue). The x-axis corresponds to the genomic location as illustrated in the upper panel. The primary y-axis (left) represents the CH P value (solid lines); the secondary y-axis (right) represents the difference in M value between the cases and controls (dashed lines). BWS-MLMD, Beckwith-Wiedemann syndrome-multi-locus methylation disorders; TND-MLMD, transient neonatal diabetes-multi-locus methylation disorders.
