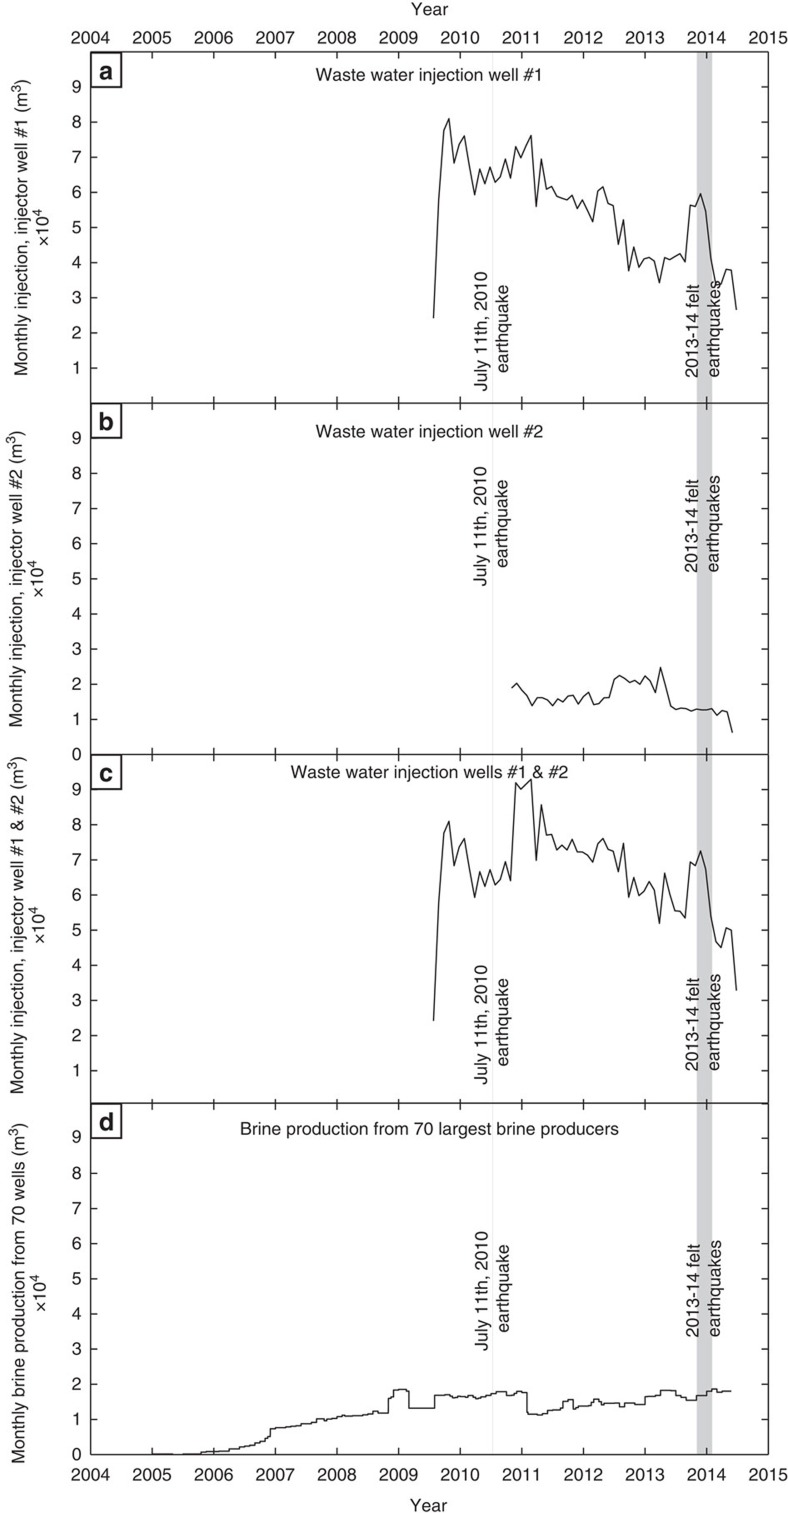
Figure 3. Regional wastewater injection and production volumes versus time.
Monthly injection volume versus time at injector well #1 (a). Monthly injection volume versus time at injector well #2 (b). Combined monthly injection volume for both injector well #1 and injector well #2 (c). Estimated monthly water production with time for the 70 largest water producing wells within 10 km of earthquake epicentres (d). Note that the scales for all of these plots are the same.

