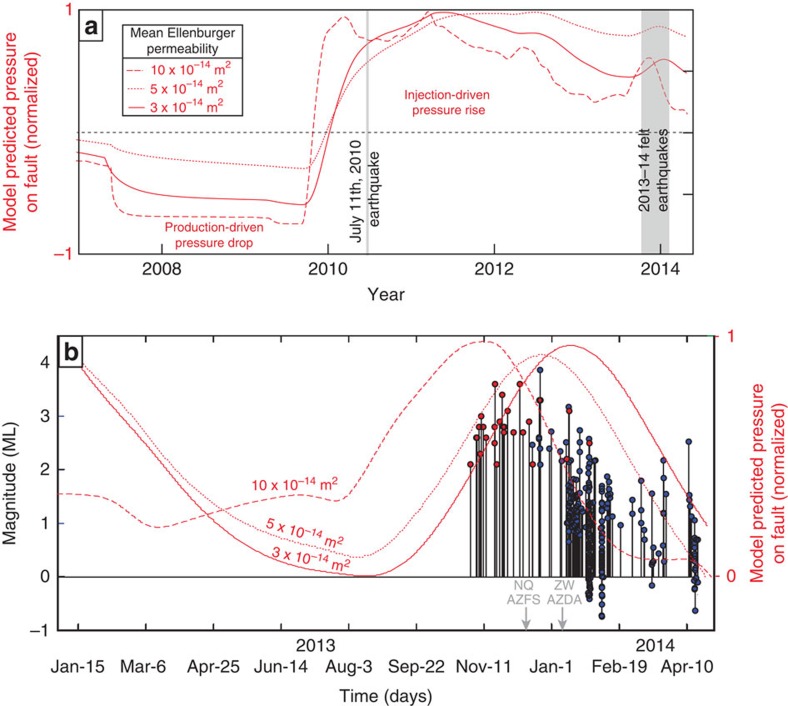
Figure 4. Pressure at the antithetic fault versus time.
Modelled pressure versus time at the antithetic fault, directly below seismometer AZDA (Fig. 2a) (a). Results include three different mean Ellenburger permeability values and demonstrate earthquake activity correlates in time with a local pressure maximum but not an absolute maximum at this site. Higher resolution time image of modelled injection pressures versus time at AZDA with earthquakes (stem and circle) coloured by network (NEIC-red; SMU-blue) (b). In 2010, one small (<M 2.5) earthquake was detected in the study area17. Event detection increases beginning on 15 December, the date when the first Netquakes station (NQ_AZFS) was deployed. Detection further improved when station ZW_AZDA was installed. Model results indicating pressures increase along the fault near the time of felt seismicity, with a 1–3-month delay between injection rate increase and pore pressure change at the fault based on permeability values measured at injector well #1.

