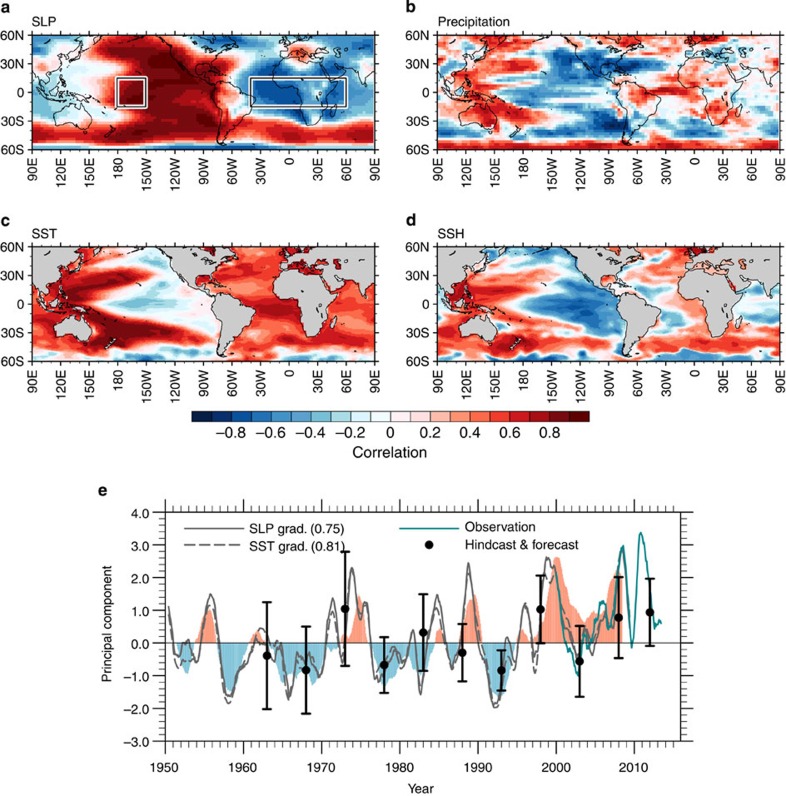
Figure 2. Patterns associated with the trans-basin variability.
Correlation maps of (a) SLP, (b) precipitation, (c) SST and (d) SSH anomalies with the principal component (shaded in e) of the leading correlation-matrix based EOF for global SLP anomalies (60° S–60° N) smoothed by 36-month running mean filter (explaining 31.7% of variance) in the assimilation run. Grey and turquoise solid lines (e) denote the 12-month running mean tropical SLP-based TBV index (Pacific minus Atlantic SLP anomalies averaged over the boxes in a in the assimilation run and the observation (ERA-interim43) from 2000 to 2013, respectively. Broken line (e) is the tropical SST-based TBV index (bracket; correlation coefficient with the principal component). Black circles and bars denote the hindcasting and forecasting ensemble mean of the tropical SLP-based TBV index and its spread for 2–5 years lead time.

