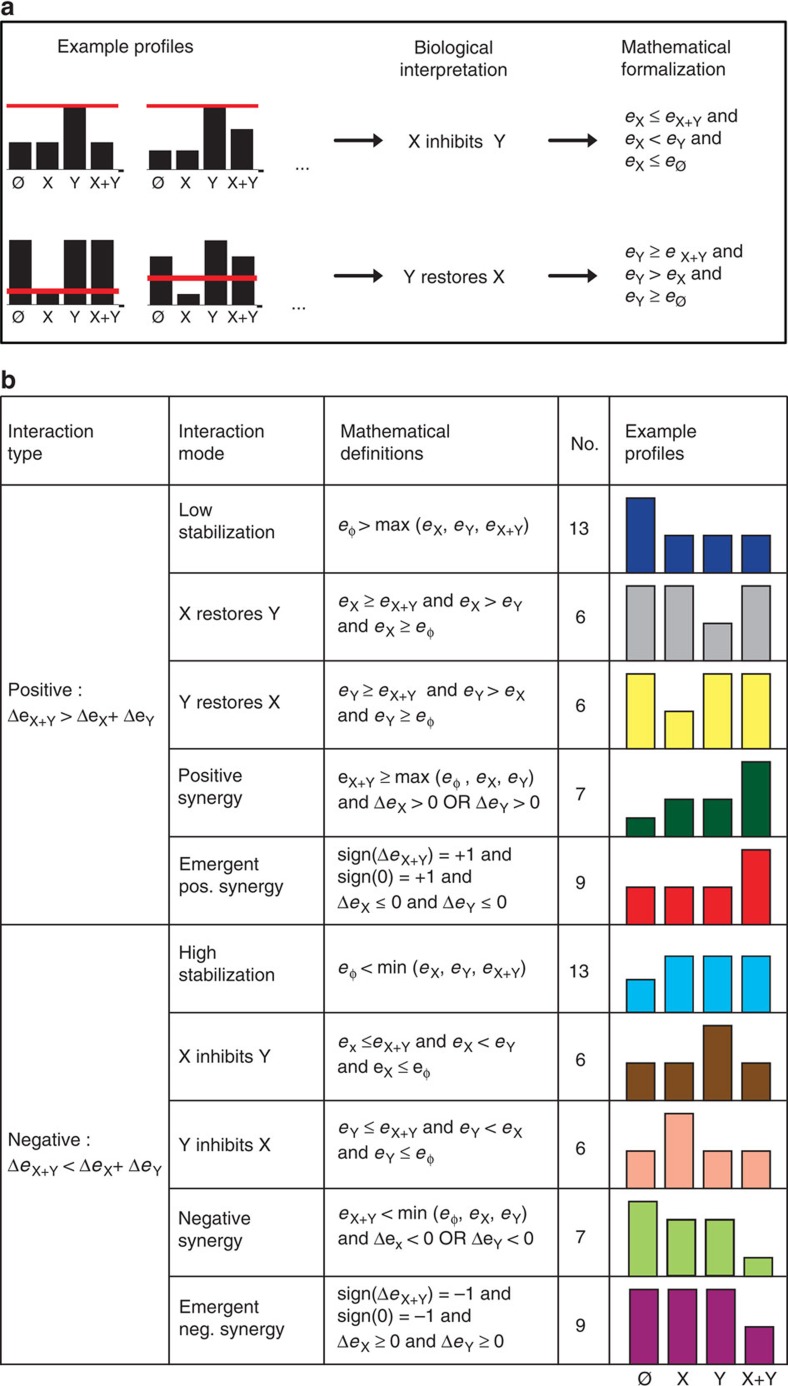
Figure 2. Classification of the 82 interaction profiles into 10 biological interaction modes.
(a) Classification procedure on example interaction profiles belonging to the ‘X inhibits Y' and ‘Y restores X' interaction modes. The red line corresponds to the height of X+Y if the integration of the stimuli was additive. (b) Table showing the classification of the 82 interaction profiles in 10 groups called interaction modes. Each interaction mode contains a subset of interaction profiles that share a biological interpretation and satisfy common mathematical rules. The number of interaction profiles contained in each mode is shown as well as one representative interaction profile. Neg, negative; Pos, positive.

