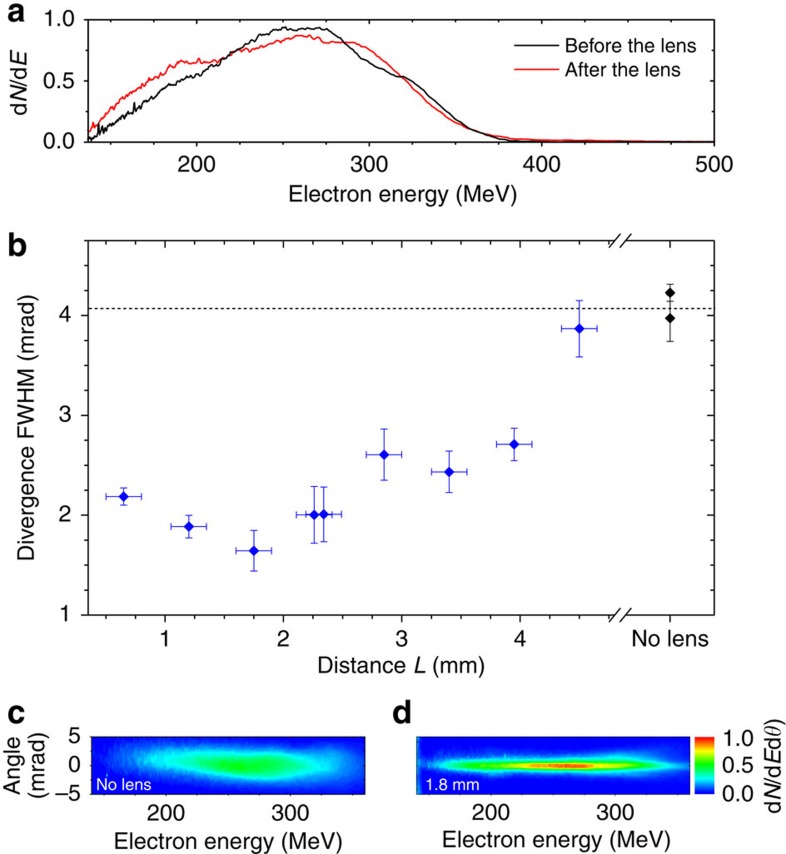
Figure 2. Influence on the electron beam divergence of the distance between the accelerator and the lens L.
(a) Electron spectrum before and after the lens, normalized by 1.3 × 10⁵. The distance between the two stages is L=1.8 mm. (b) FWHM beam divergence, at 270 MeV, as a function of L (blue diamonds). The divergence measured without the laser-plasma lens is indicated by the black diamonds on the right. The peak electron density in the focusing stage is ∼3.9 × 1018 cm−3. Data points were averaged over 10 shots; the vertical error bars correspond to the s.e.m. and the horizontal bars correspond to the precision on the measurement of L. Two series of 10 shots were fired for L=2.3 mm, and the case without lens. (c) Typical angularly resolved spectrum without laser-plasma lens. (d) Typical spectrum obtained for L=1.8 mm. The colour scale indicates the number of electrons per MeV and mrad, divided by 17,000.

