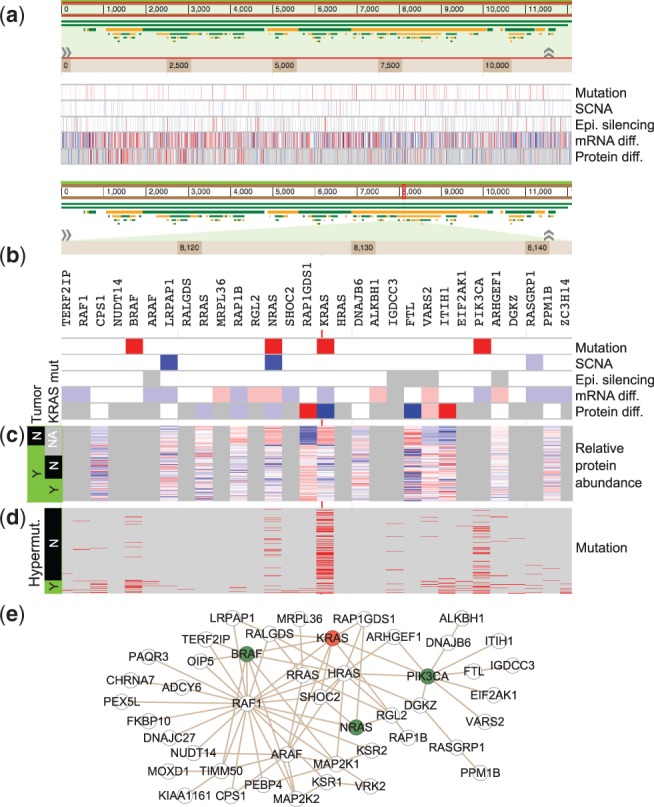
Fig. 2.

Retrieving information for KRAS. (a) The Omics snapshot summarizes the tumor-related somatic mutations, SCNAs, epigenetic alterations and differential expression at mRNA and protein levels for all genes. For somatic mutation, red represents significantly mutated genes and light red represents genes mutated in at least 5% of the CRC samples; for SCNA, red/light red represent genes in the focal amplification regions and blue/light blue represent genes in the focal deletion regions, with red/blue representing candidates drivers; for epigenetic alteration, red represents epigenetically silenced genes; for mRNA/protein expression, red and blue represent significantly over- and under-expressed genes with fold change >2, whereas light red and light blue represent significantly over- and under-expressed genes with fold change <2. Grey represents missing data. (b) When zooming into the KRAS gene, it can be seen that KRAS is significantly mutated in CRC and down regulated at both mRNA and protein levels in tumors compared with normal colon biopsies. Data for genes in the network neighborhood are visualized simultaneously. (c) The proteomics data show that the KRAS protein abundance is lower in tumors compared with normal controls; however, tumors with mutant KRAS have higher KRAS abundance compared with those without mutant KRAS. Red and blue represent relative over- and under-expression, respectively. (d) Sample-level mutation information for KRAS and genes in this network neighborhood. (e) Protein–protein interactions between KRAS and genes in this network neighborhood
