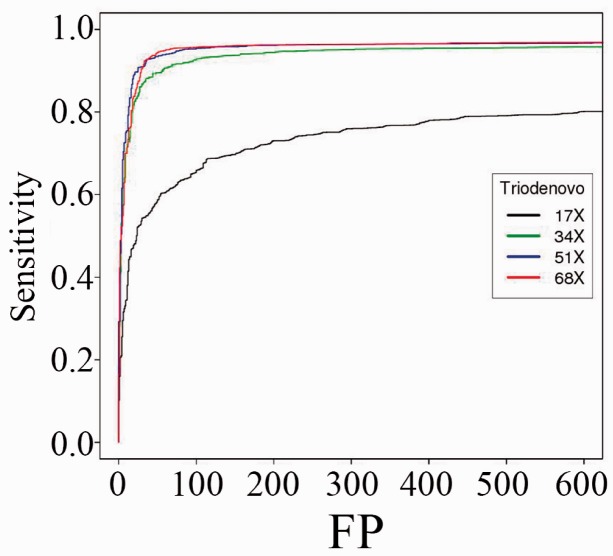
Fig. 1.
ROC curves of de novo SNV mutations called by TrioDeNovo in simulated datasets with different coverage. Sensitivity and false positive rates were calculated for sequencing coverage of 17× (black), 34× (green), 51× (blue) and 68× (red) with flat prior odds for all candidates (color version of this figure is available at Bioinformatics online.)

