
Fig. 4.
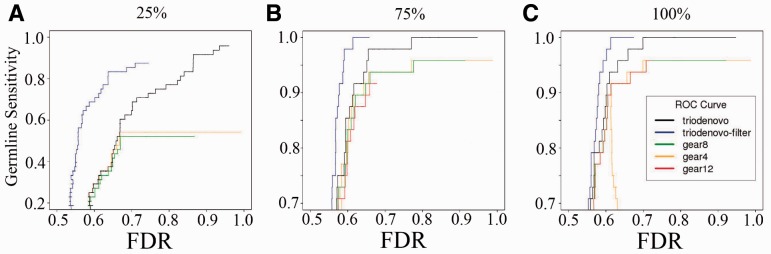
ROC curves of de novo germline SNV mutations called by TrioDeNovo and DeNovoGear in the 1000G CEU trio filtered using DNMfilter. Blue lines represent the ROC curves of the TrioDeNovo calls after applying DNMFilter and other lines are the same as those in Figure 3 (color version of this figure is available at Bioinformatics online.)