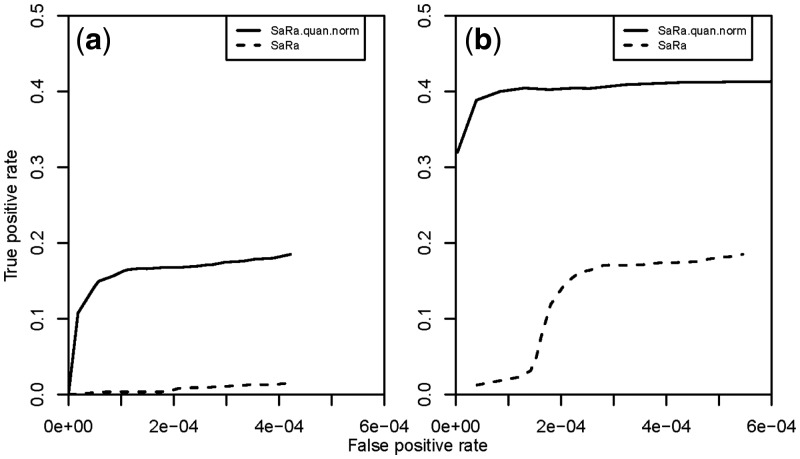
Fig. 3.
Performance of SaRa on simulated datasets with noise intensities following t-distributions. We simulated 100 signal sequences with length 10 000. Ten change regions were chosen at each sample sequence. The jump sizes for the change regions were (2.56, −3.47, 3.02, 3.26, −3.92, −3.12, 1.74, 3.05, −3.09, −2.69). The change segment lengths were (35, 18, 79, 62, 51, 27, 84, 32, 26, 19). The true positive rate was the ratio of the number of observed change-points to the total number of true change-points. The false-positive rate was the ratio of the observed false change-points to the total number of points. The dashed lines denote the performance of SaRa method on the simulated dataset. The solid lines denote the performance of the SaRa method after QN of the dataset. The simulated noise sequences were distributed as (a) t(1); and (b) t(2)

