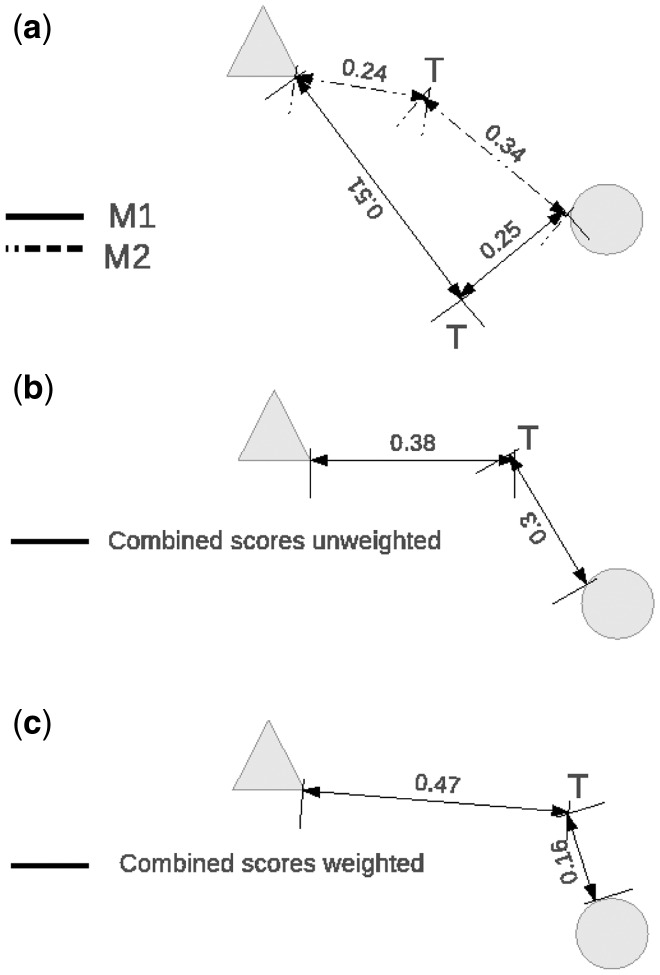
Fig. 1.
A graphical representation of how the CSSS model can improve the classification accuracy of a given test sample. M1 and M2 are two similarity measures and T is a test sample that can be assigned either a class ‘circle’ or a class ‘triangle’ that are present in the training set. In (a) according to M1, T is assigned the correct class (i.e. ‘circle’), whereas according to M2, T is assigned the incorrect class (i.e. a ‘triangle’). In (b), we show the classification according to the combined unweighted score. In (c), we show the classification according to the combined weighted score

