
Figure 3. Expression of mRNAs of the PPARG, CEBPA, FABP4, and SCD genes in control BMSCs and cells exposed to various concentrations of EGCG, which lowered the expression levels of all tested genes.
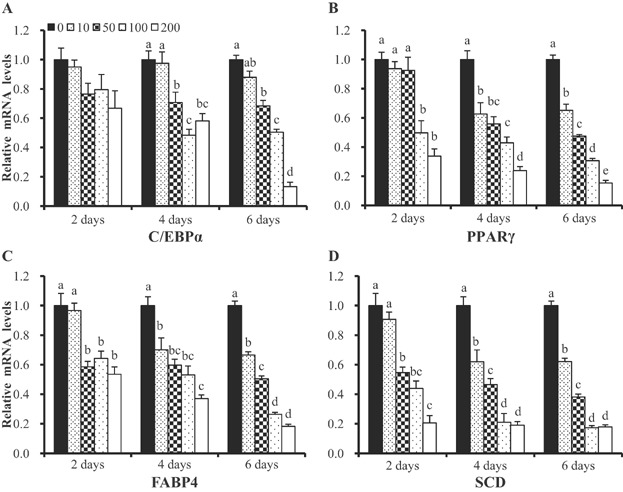
mRNA levels were determined by real-time PCR and normalized to those of a housekeeping gene. mRNA levels in control cells were normalized to unity. Values are means ± SEs. Significant difference: **P < 0.01.