
Figure 6. Flow cytometric analysis of differentiating BMSCs treated (or not) with EGCG.
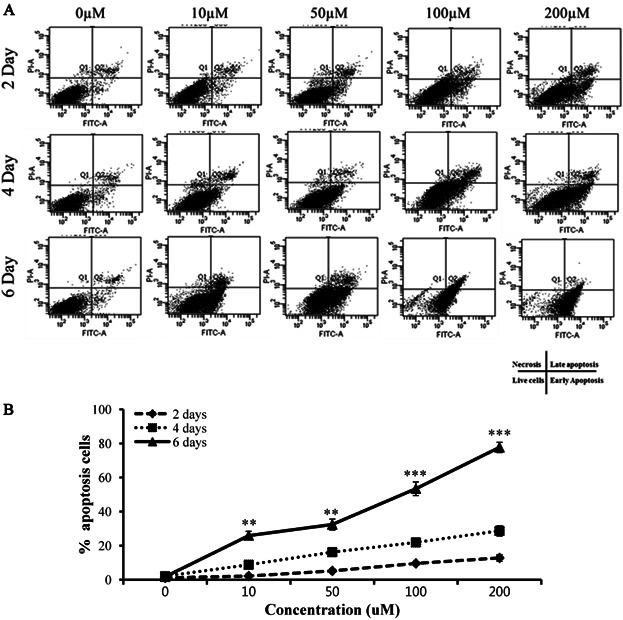
(A) The histogram shows dose- and time-dependent reductions in cell viability with concomitant increases in the numbers of Annexin A-positive cells. Phases of the cell cycle were identified via staining with propidium iodide (PI). Apoptosis was quantitated by Annexin V staining. (A) Absorbance of FITC-A: absorbance of fluorescein isothiocyanate–Annexin V (Please clarify). Q1: necrosis, Q2: late apoptosis, Q3: live cells, Q4: early apoptosis. (B) The percentages of apoptosis in cultures exposed (or not) to various concentrations of EGCG. This material triggered cell-cycle arrest and apoptosis in a time- and dose-dependent manner. Values are means ± SEMs. The letters in superscript indicate that the difference between groups was significant (P < 0.05). The x-axis shows the EGCG concentrations and the y-axis shows the percentages of apoptotic cells. The upper-right quadrant contains data on cells positive for both Annexin V and PI, and the lower-right quadrant shows quadrant information on cells positive for Annexin V but negative for PI.