
Figure 5.
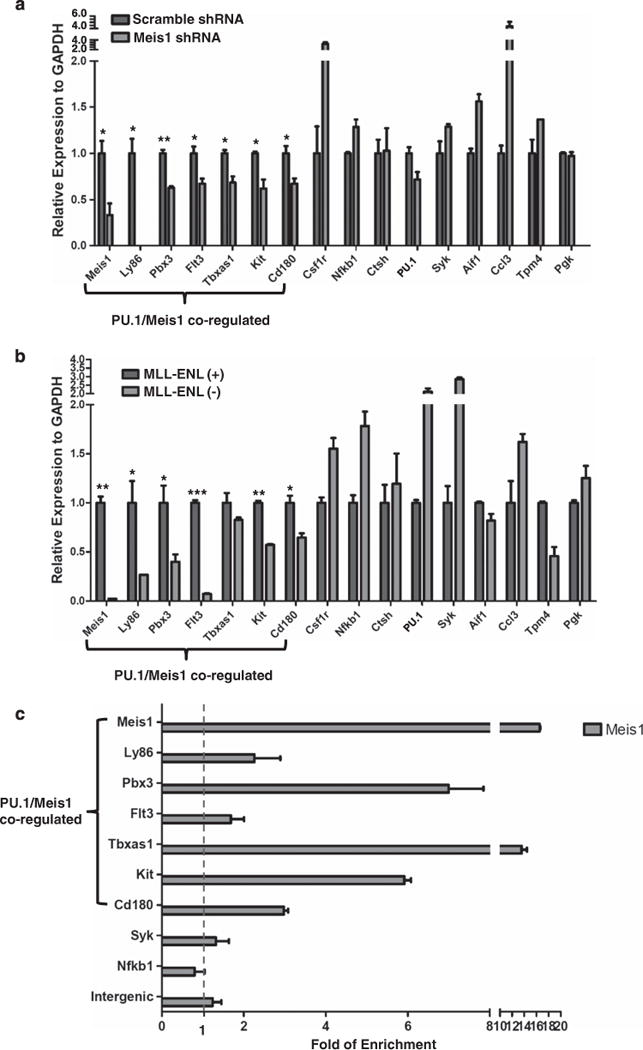
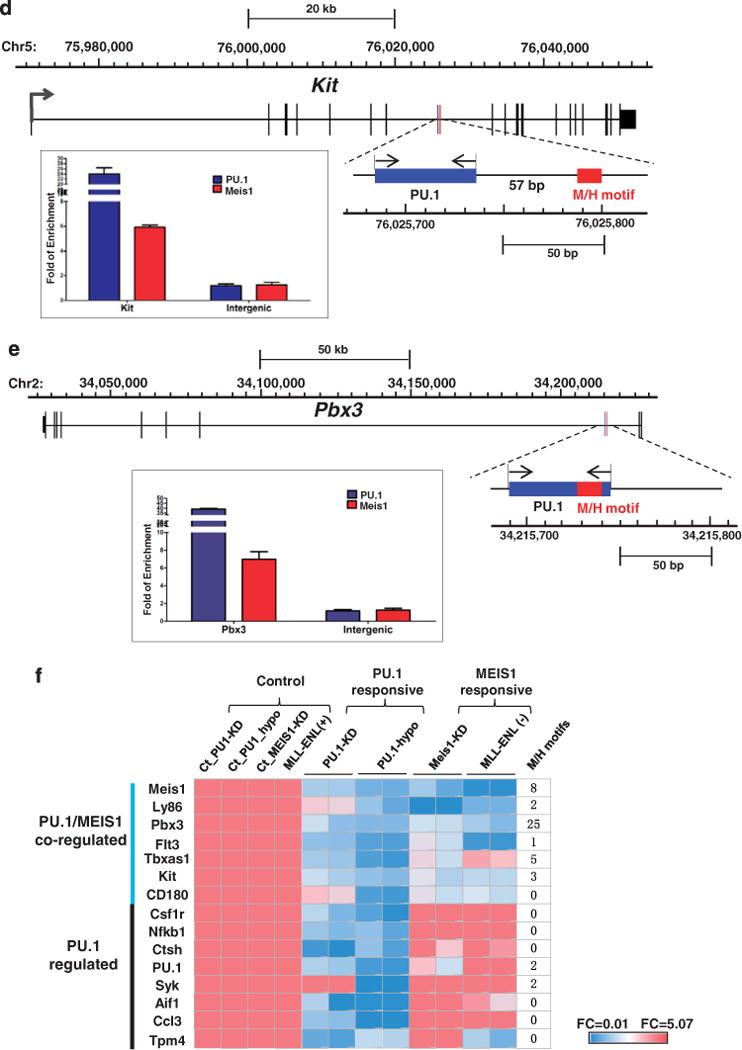
A subset of 15 PU.1 targets is also regulated by Meis1. (a) Meis1 knockdown in MLL-ENL cell line. The cells were transduced for 48 h with the lentivirus constructs of Meis1 specific shRNA or scramble shRNA control. PU.1 and its target gene expression were examined using RT-PCR. The seven PU.1/Meis1 co-regulated genes are indicated. The relative expression was normalized to GAPDH. Expression under the condition of scramble shRNA transduced cells was designated to be one. Bar charts are mean ± s.d. Genes with significantly decreased levels of expression after Meis1 knockdown are indicated (t-test, *: P<0.05, **: P<0.01). (b) Regulation of PU.1 target genes by the MLL fusion protein. Expression of PU.1 15 target genes in the presence (+) and absence (−) of MLL-ENL. Gene expression was examined through RT–PCR at a time point of 72 h after MLL-ENL inactivation (without 4HT). The relative expression was normalized to GAPDH. Expression under the condition of MLL-ENL (–) was designated to be one. Bar charts are mean ± s.d. Genes with significantly decreased levels of expression after MLL-ENL inactivation (without 4HT) are indicated (t-test, *: P<0.05, **: P<0.01, ***: P<0.001). (c) MEIS1 binding at gene regions of PU.1 target genes. MEIS1 binding at regions with predicted MEIS1/HOXA9 motifs was examined using ChIP-qPCR. The amounts of input DNA and ChIP DNA were normalized and the data are shown as relative enrichment ratios of precipitated DNA to input DNA. Intergenic region was used as the negative control. Bar charts are mean ± s.d. The seven PU.1/Meis1 co-regulated genes (a and b) are indicated. The dotted line indicates the level of no enrichment over input. (d) PU.1 and Meis1 co-binding at the c-Kit locus. The DNA element bound by both PU.1 and Meis1 is enlarged from the gene structure (chromosome coordinates from mm9 are indicated). Positions of the conserved MEIS1/HOXA9 motif (http://genome.ucsc.edu/) and the PU.1 binding signal detected by ChIP-qPCR are shown as red and blue rectangles, respectively. The paired arrows above the DNA element represent the primers used in detecting the binding of both Meis1 and PU.1. The enrichments levels of MEIS1 and PU.1 detected by ChIP-qPCR are shown in the bar plot. Bar charts are mean ±s.d. (e) PU.1 and Meis1 co-binding at the Pbx3 locus. The DNA element bound by both PU.1 and MEIS1 is enlarged from the gene structure (chromosome coordinates from mm9 are indicated). Positions of the conserved MEIS1/HOXA9 motif (http://genome.ucsc.edu/) and the PU.1 binding signal detected by ChIP-qPCR are shown as red and blue rectangles, respectively. The paired arrows above the DNA element represent the primers used in detecting the binding of both MEIS1 and PU.1. The enrichments levels of MEIS1 and PU.1 detected by ChIP-qPCR are shown in the bar plot. Bar charts are mean ±s.d. (f) Heatmap for the fold change of 15 PU.1 target gene expression under various conditions (the same data used for Figures 4a and b, a and b, and summarized in this heatmap). PU.1-KD: PU.1 knockdown in MLL-ENL cells (data for Figure 4a); PU.1-Ki/Ki: hematopoietic stem and progenitor cellss from mRUNX UREki/ki mice (data for Figure 4b); MEIS1-KD: MEIS1 knockdown in MLL-ENL cells (data for a); and MLL-ENL (+) (−): MLL-ENL cells under MLL-ENL induced or inactivated condition (data for b). Each experimental condition had a control group (ct). The level of gene expression is indicated by a color code: genes with relatively higher expression level changes are shown in red and lower changes are shown in blue. M/H: MEIS1/HOXA motif.