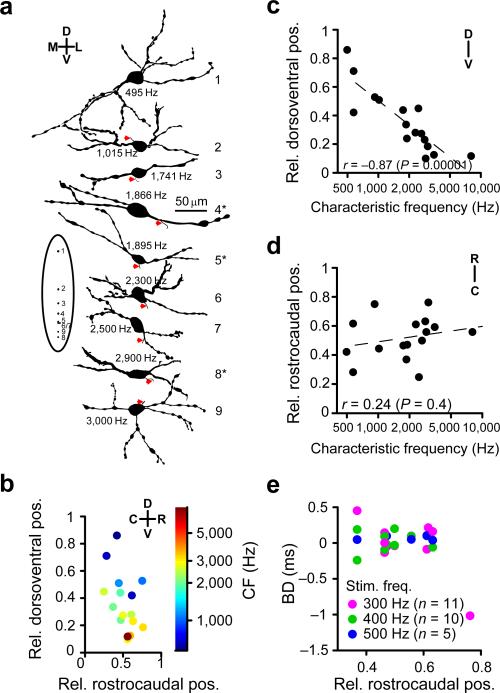
Figure 2.
Anatomical location of MSO neurons. (a) Camera lucida drawings (made by Dr. P.H. Smith). CF is indicated with each neuron. Inset on the left shows position of the cell bodies on a schematic dorsoventral MSO outline. Red arrowheads indicate axonal origin. Asterisks indicate the neurons with shifts of 200 μs or more. (b) Projection of retrieved cell bodies on a normalized side view of the MSO. Abscissa is the normalized rostrocaudal location for the coronal section in which the cell body was localized (0 corresponds to caudal pole and 1 to rostral pole of the MSO). Ordinate is the normalized dorsoventral distance for the coronal section in which the cell body was located (0 corresponds to ventral border and 1 to dorsal border of the MSO). Colors indicate characteristic frequency. (n = 16) (c,d) Normalized dorsoventral (c) and rostrocaudal (e) positions of MSO neurons as a function of characteristic frequency. Dashed lines are linear fits (n = 16). c: linear correlation t(14) = –6.47 (n = 16). d: linear correlation t(14) = 0.92 (n = 16). (e) Best delay as a function of normalized rostrocaudal position. Color indicates stimulus frequency. There is no evidence for a rostrocaudal map of best delays.

