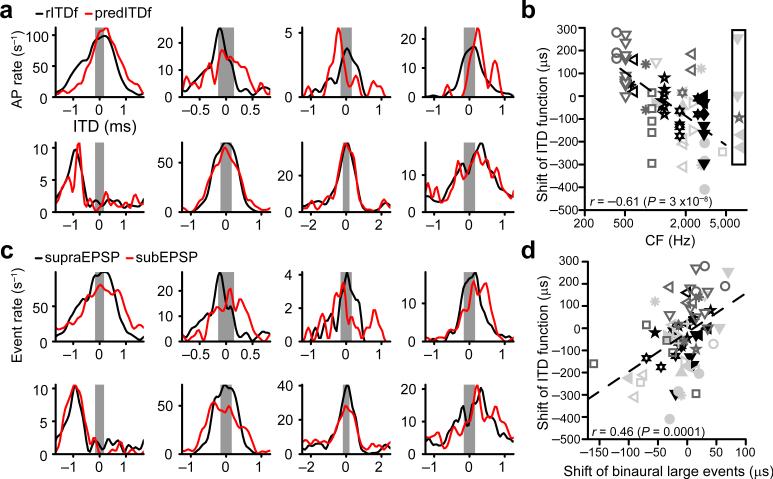
Figure 3.
ITD tuning of MSO neurons often deviates from instantaneous coincidence detection. (a) rITDf (black lines) and predITDf (red lines) for 8 datasets. Grey rectangles indicate the approximate physiological ITD range (± 130 μs29). Respective stimuli (left to right, top to bottom, ipsi/contra): 300/301 Hz 70 dB; 600/601 Hz 60 dB; 400/401 Hz 70 dB; 400/401 Hz 70 dB; 300/301 Hz 90 dB; 400/401 Hz 70 dB; 200/201 Hz 90 dB; 400/401 Hz 60 dB. Respective characteristic frequencies: 1895 Hz; 923 Hz; unknown; 1741 Hz; 3031 Hz; 3031 Hz; 1154 Hz; 2639 Hz. Top row shows neurons with a mismatch between rITDf/predITDf, whereas the neurons in the bottom row show good correspondence. (b) Shift between rITDf and predITDf as a function of characteristic frequency for 72 datasets (28 neurons) with significant suprathreshold ITD tuning (Rayleigh test α < 0.001). Rectangle indicates datasets with unknown characteristic frequency. Different symbols correspond to different neurons. Linear correlation: t(65) = –6.26 (67 datasets from 25 neurons). (c) ITD tuning of subEPSPs (black lines) and supraEPSPs (red lines) for the datasets in a. (d) Shift between rITDf and predITDf (as in b) relative to the shift between subEPSPs/supraEPSPs ITD tuning (from c). Same symbols as in b (one outlying data point is not shown but included in the correlation). Linear correlation: t(70) = 4.31 (72 datasets from 28 neurons).

