Figure 4.
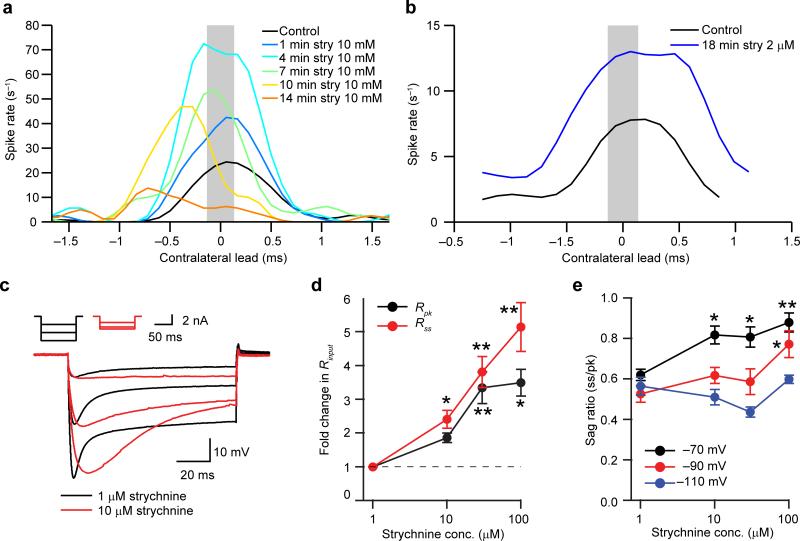
Concentration dependent effects of strychnine on ITD functions and intrinsic physiology. (a) ITD function of one neuron before and during strychnine iontophoresis (10 mM). ITD functions progressively changed, suggesting concentration dependent effects. Stimulus: 300 Hz/80 dB SPL. Characteristic frequency = 1149 Hz. (b) ITD functions before and during strychnine (2 μM) application by pressure. The increased spike rate demonstrates that the dose effectively antagonized inhibition, but there was no leftward shift in the position of the ITD function. Stimulus: 400 Hz/70 dB SPL. ITD functions are static ITD functions. Characteristic frequency = 538 Hz. (c) In vitro responses of an MSO neuron to hyperpolarizing current steps delivered in the presence of 1 μM (black) or 10 μM (red) strychnine. Inset shows current steps used to elicit responses. (d) Peak (Rpk) and steady state (Rss) input resistances increased with increasing strychnine concentrations. Data are normalized to resistances measured in 1 μM strychnine. (e) Increasing strychnine concentrations increased the sag ratios of current steps that elicited peak hyperpolarizations to –70 mV but not –110 mV, suggesting a shift in Ih activation to more hyperpolarized potentials. (d,e) One-way two-tailed ANOVA with Tukey's post-hoc. Rpk: F(3,19) = 7.459; n = 7, 7, 5, 4; P = n.a., 0.221, 0.002, 0.012. Rss: F(3,19) = 12.731; n = 7, 7, 5, 4; P = n.a., 0.049, 0.001, 0.0001. Sag ratio at –70 mV: F(3,17) = 7.144; n = 6, 6, 5, 4; P = n.a., 0.013, 0.026, 0.004. Sag ratio at –90 mV: F(3,17) = 3.704, n = 6, 6, 5, 4; P = n.a., 0.535, 0.822, 0.021. Sag ratio –110 mV: F(3,17) = 3.340, n = 6, 6, 5, 4; P = n.a., 0.681, 0.096, 0.922. n and P values listed for 1, 10, 30, 100 μM, respectively. * P < 0.05, ** P < 0.01. Data in d and e represent mean ± s.e.m.

