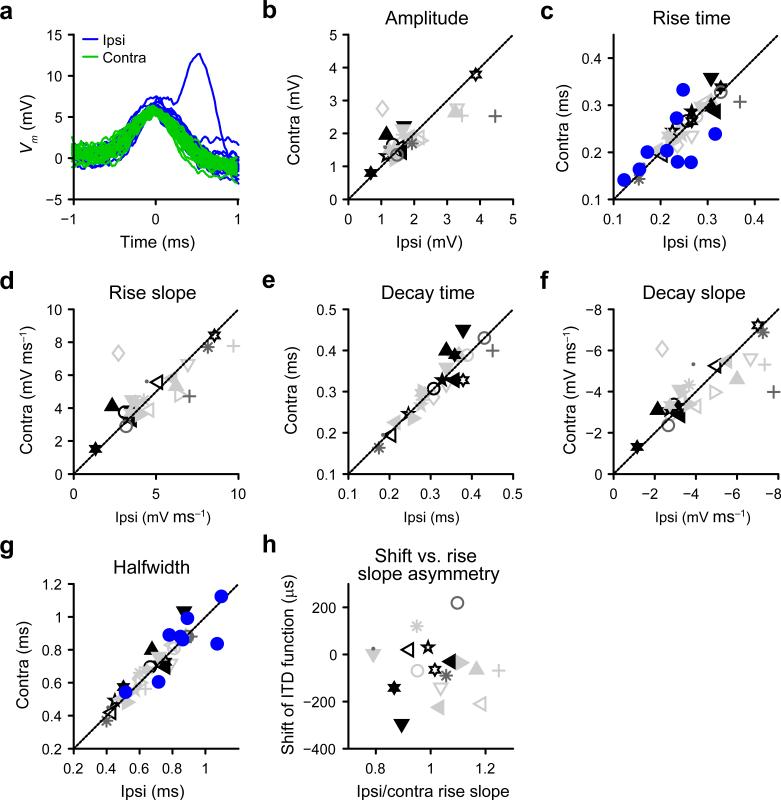
Figure 5.
Symmetry of monaural excitatory inputs. (a) Superposition of the 20 largest EPSPs during monaural ipsilateral (blue) and monaural contralateral (green) stimulation, for a neuron with characteristic frequency = 1000 Hz. (b)-(g), Scatter plots of several EPSP metrics for the population of MSO neurons, to monaural stimulation with 300 or 301 Hz tones at 70 dB SPL (n = 26). Symbols as in Figure 3b. For each dataset, the median value of the metric during monaural contralateral stimulation is shown relative to its ipsilateral equivalent. Diagonal line indicates identity. For rise time (c) and halfwidth (g), blue filled circles show the same data for in vitro thick slice recordings (n = 9). (h) Scatter plot of shift of rITDf relative to predITDf as a function of the relative size of ipsilateral EPSP rise slope (rise slope ipsi / rise slope contra). Correlation is not significant (linear correlation r = –0.075, t(16) = -0.30, P = 0.77 (18 datasets from 18 neurons)).

