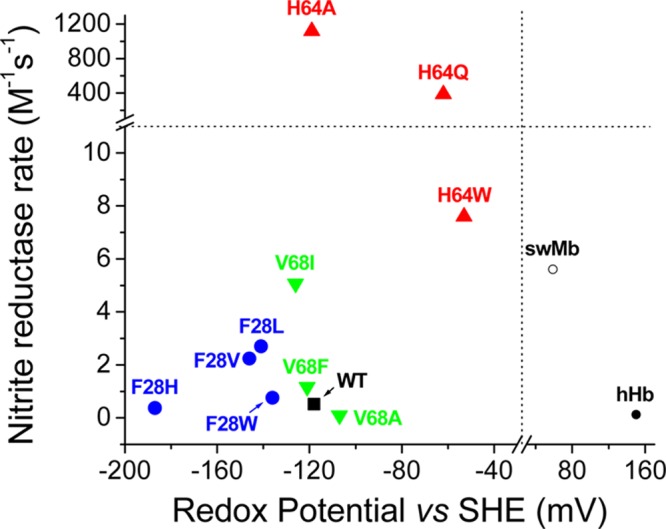
Figure 6.

Relationship between the observed nitrite reductase rates and the redox potential. The different symbols denote different Ngb mutations as follows: filled square, wild-type Ngb; filled circles, Phe28 mutants; upward-pointing triangles, His64 mutants; downward-pointing triangles, Val68 mutants; empty circle, wild-type sperm whale myoglobin; filled circle, human hemoglobin. The dashed lines indicate the breaks in the X and Y axes.
