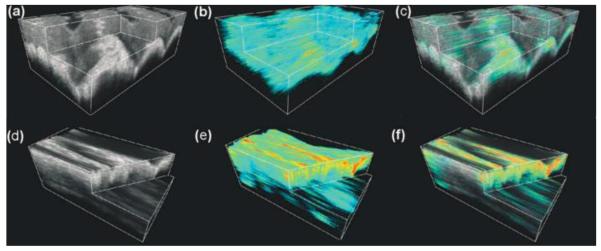
Figure 13.
Typical 3D elastogram of in vivo human skin tissue. (a), (b) and (c) are the OCT, OCE and overlay images from the skin of middle finger under normal condition, respectively; (d), (e) and (f) are the OCT, OCE and overlay images from hydrated skin of middle finger, respectively. Reproduced from Ref. [72].

