
Figure 2.
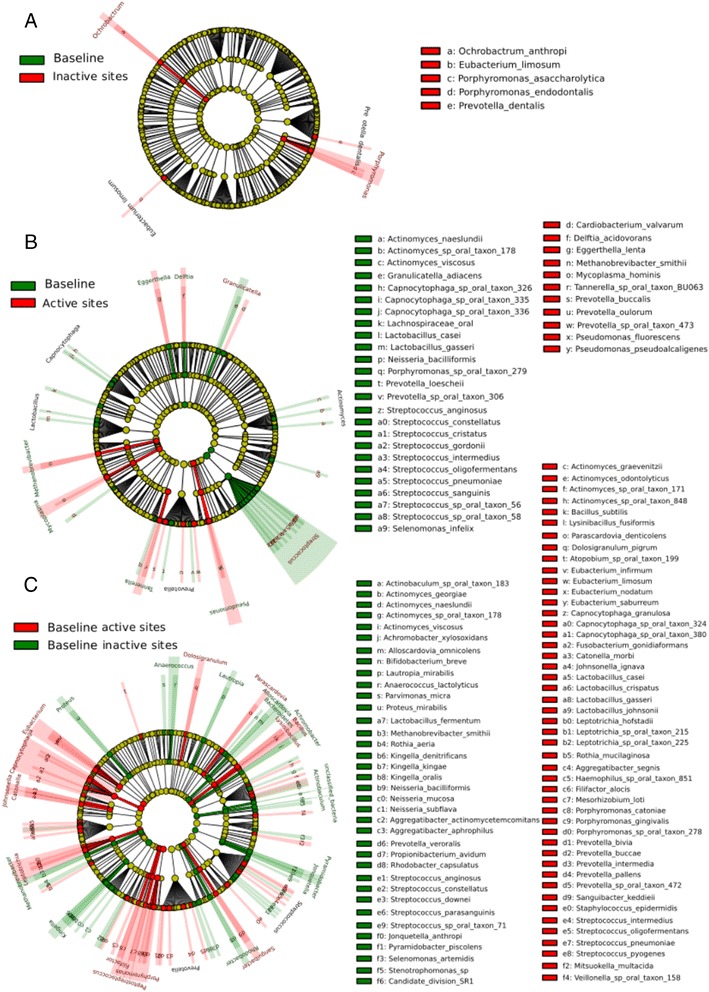
Statistical differences in metatranscriptome normalized composition. Metatranscriptome hits were first normalized by the relative frequency of species obtained in the metagenomic analysis using GASIC. Normalized counts were then analyzed using LEfSe with default parameters to identify significant differences in activity at the species level. (A) Comparison baseline samples from active sites vs. progressing samples from active sites (that is, samples collect at the visit when an increase in CAL ≥2 mm was detected). (B) Comparison baseline samples from stable sites vs. follow-up samples from stable sites (that is, collected 2 months after baseline). (C) Comparison baseline samples from active sites vs. baseline samples from stable sites.