
Figure 4.
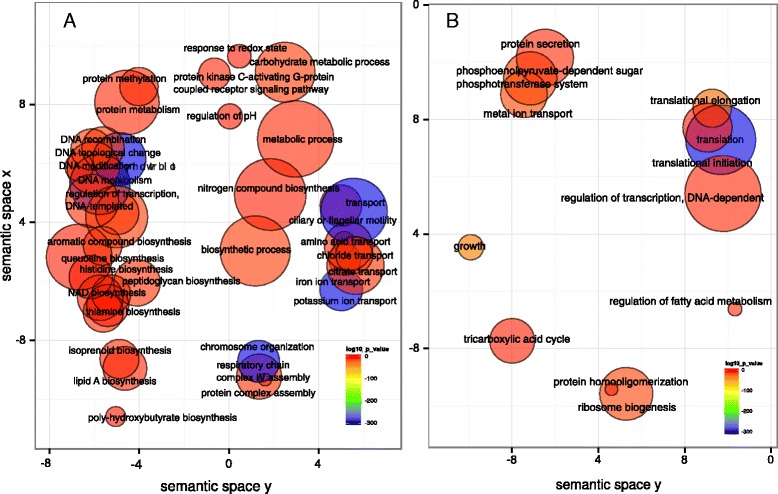
GO enrichment analysis comparison of baselines from progressing and non-progressing sites. Enriched terms obtained using goseq were summarized and visualized as a scatter plot using REVIGO. (A) Summarized GO terms related to biological processes in baselines of progressing sites. (B) Summarized GO terms related to biological processes in baselines of non-progressing sites. Circle size is proportional to the frequency of the GO term, while color indicates the log10 P value (red higher, blue lower).