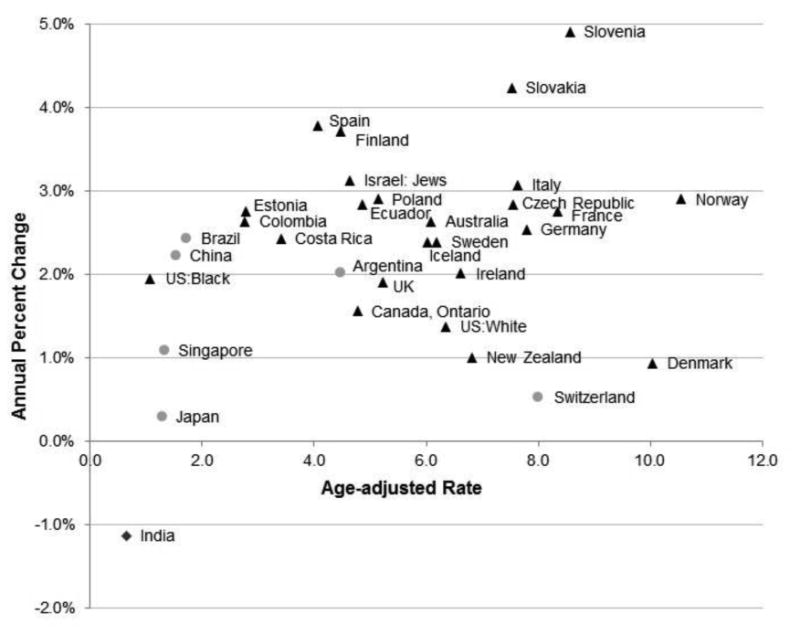
Figure 1.

Annual Percent Change (APC) in age-adjusted incidence rate from 1973-1977 through 2003-2007 plotted by the age-adjusted rate in 2003-2007. Triangles represent populations in which the APC increased (p-value < 0.05), circles represent populations in which the APC remained constant (p-value ≥ 0.05), and the diamond represents the population in which the APC decreased across the time period evaluated (p-value < 0.05).
