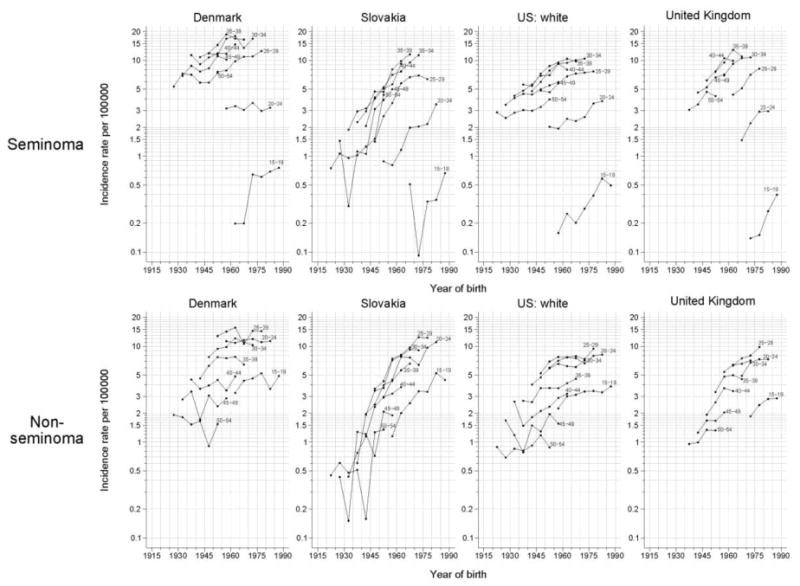
Figure 5.

Testicular cancer incidence rates per 100,000 man-years by year of birth for seminoma (top) and nonseminoma (bottom) from four selected countries. Rates are displayed on a semilog scale. For each graph, rates in the 5-year age-groups 15-19, 20-24, …, 50-54 years are plotted.
