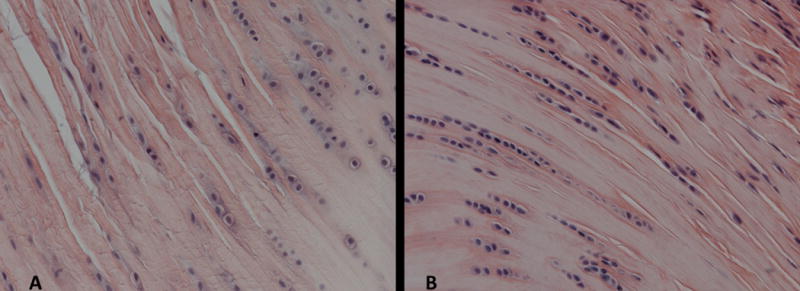
Figure 3.

Tendon histology (supraspinatus and biceps) was quantified for cell shape and cell density at the insertion and mid-substance regions. A representative image for the supraspinatus insertion is displayed. Cell density was significantly increased (*p<0.05) in the SD group (B) compared to the control group (A) (N=5 at each time point).
