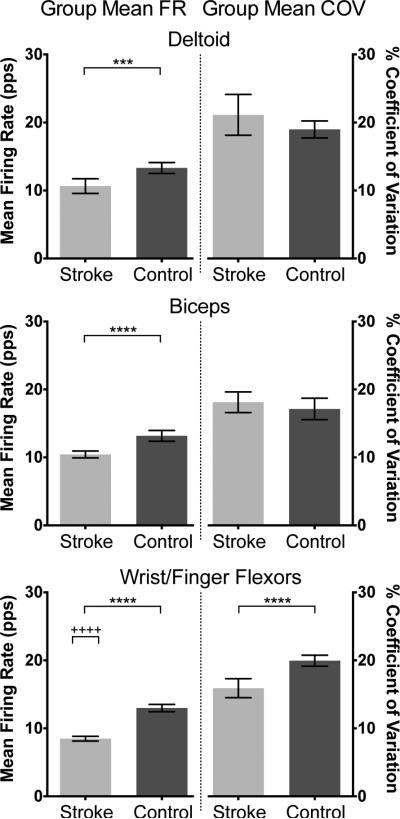
Fig. 3.
Group mean firing rates (FRs) and coefficients of variation (COV) of each muscle for stroke and control groups across all motor units and torque levels are shown with 95% confidence intervals. Group mean FRs were lower in the stroke group for all muscles, and group mean COV was lower in the stroke group for WFF (***/**** indicate p < 0.001/p < 0.0001). In the stroke group, mean FRs were lower for WFF than for DELT or BIC (++++ indicates p < 0.0001).

