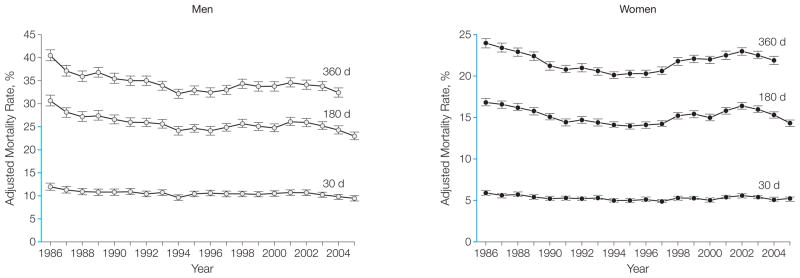
Figure 3.

Trends in Risk-Adjusted Mortality at 30, 180, and 360 Days
Data are based on 20% Medicare claims; error bars indicate 95% confidence intervals. Rates are adjusted for age, race, region, and comorbid conditions. There were no data available to accurately ascertain 360-day mortality in 2005. Regions of y-axes that are in blue indicate a mortality rate of 0% to 25%.
