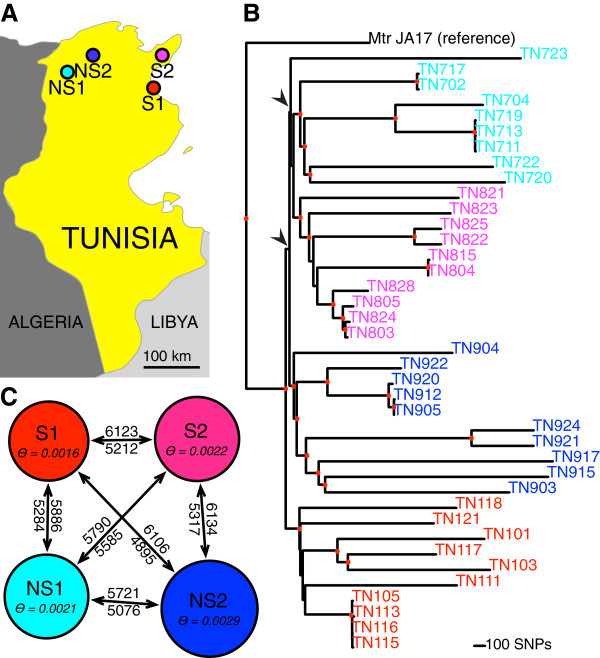
Figure 1.

Tunisian M. truncatula from saline and non-saline sites. ( A ) Tunisian collection sites. ( B ) Neighbor-joining phylogeny of all SNPs. Red dots indicate nodes with bootstrap support greater than 80%. Nodes subtending splits between populations TN7, TN8, and TN9 are indicated with arrows and do not have bootstrap support. ( C ) MIGRATE-N analysis of the four populations; numbers above the arrow are M estimates going left-to-right and numbers below are the reverse. Results are averaged across ten replicate sets of 96 loci.
