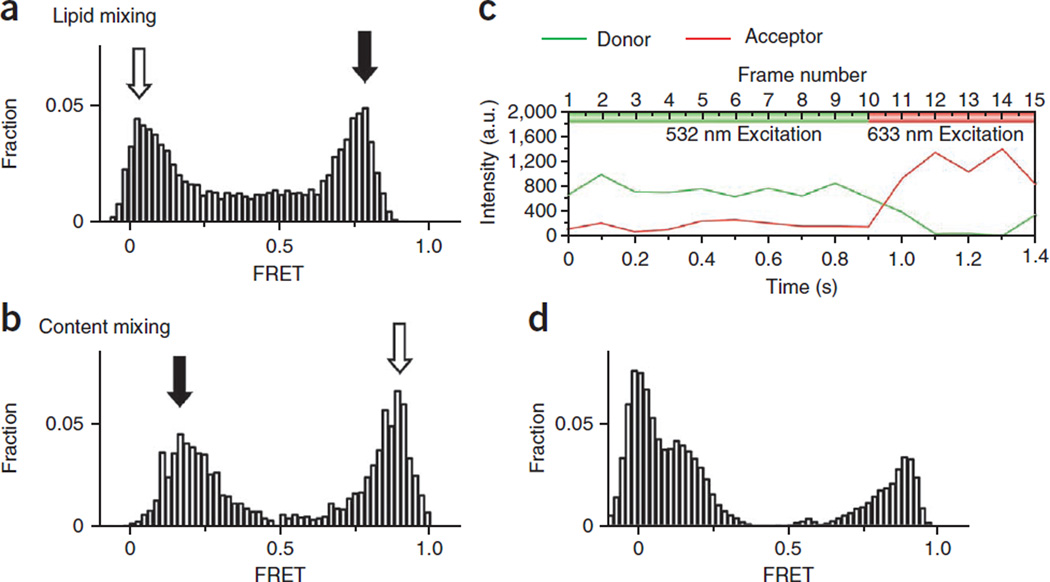
Figure 5.
Experimental results. E distribution from a lipid mixing (a) is obtained by continuous 532-nm laser excitation. The y axis is the normalized population and the x axis is E. Open and solid arrows indicate nonfused and fused vesicle populations, respectively. Owing to background contribution in the acceptor channel from direct excitation, the FRET histogram is plotted on the basis of vesicles identified in the donor channel only. (b) The E distribution from a typical content-mixing assay is obtained from FRET beacon molecules containing both donor (Cy3) and acceptor (Cy5) dyes. Open and solid arrows indicate nonfused and fused vesicle populations, respectively. Unlike the lipid-mixing sample, in which labeling efficiency is ensured by the presence of multiple dyes in the vesicle membranes, some dual-labeled DNA probes may lack one or both dyes. (c) The presence of both dyes may be verified by short (5 frames) exposure of 633-nm illumination followed by 532-nm (10 frames) illumination. (d) With only 532-nm excitation, the E distribution shows an extra donor-only peak at E = 0. We selected only those DNA probes with both donor (532-nm excitation) and acceptor (633 nm excitation) fluorescence signals to construct the final histogram (b). a.u., arbitrary units.

