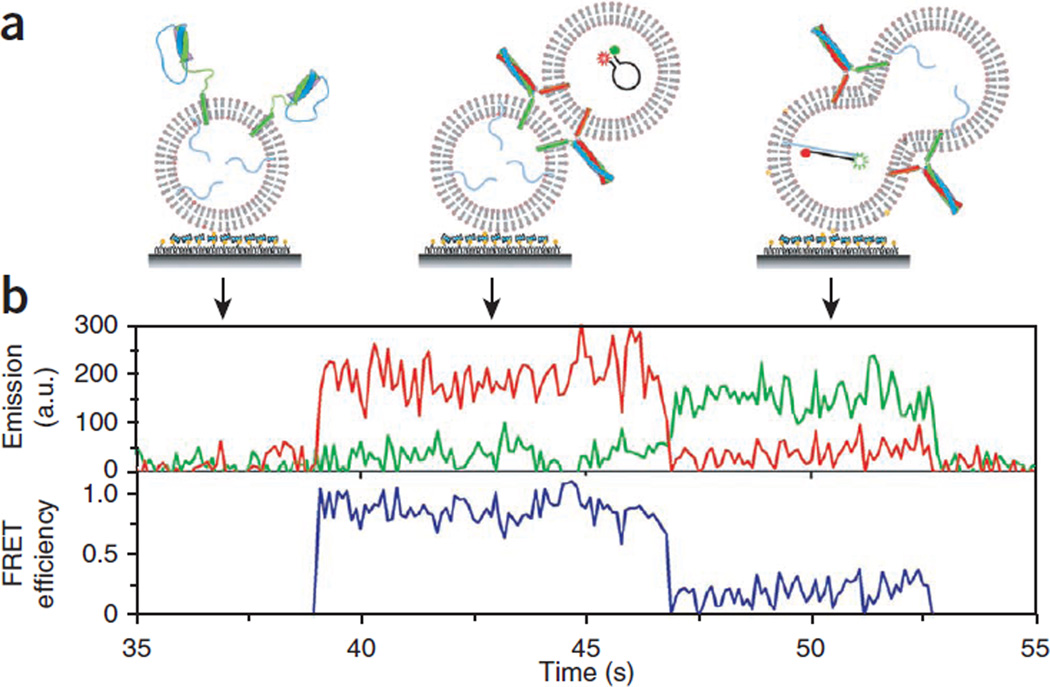
Figure 7.
Real-time content mixing for content labeling only. (a) For this real-time experiment, we switched the surface immobilization configuration so that vesicle docking can be clearly marked as an abrupt increase in fluorescence signal. t-vesicles with the target DNAs (poly-A) are surface-immobilized and v-vesicles containing FRET beacons are flowed into the imaging chamber. To eliminate DNA molecules outside vesicles, DNase I treatment was applied before reactions. (b) A real-time content-mixing time trajectory of fluorescence intensities (green curve for Cy3, red curve for Cy5) and the corresponding E (blue curve). a.u., arbitrary unit.

